
Know where your sales come from. And what they're worth.
Six connected reports, Overview, Leads & Marketing, Sales, Appointments, Fitters and Payments, built from the records your team already keeps. Compare with the previous period or the same time last year.Six connected reports from the records your team already keeps, compared with the previous period or last year.
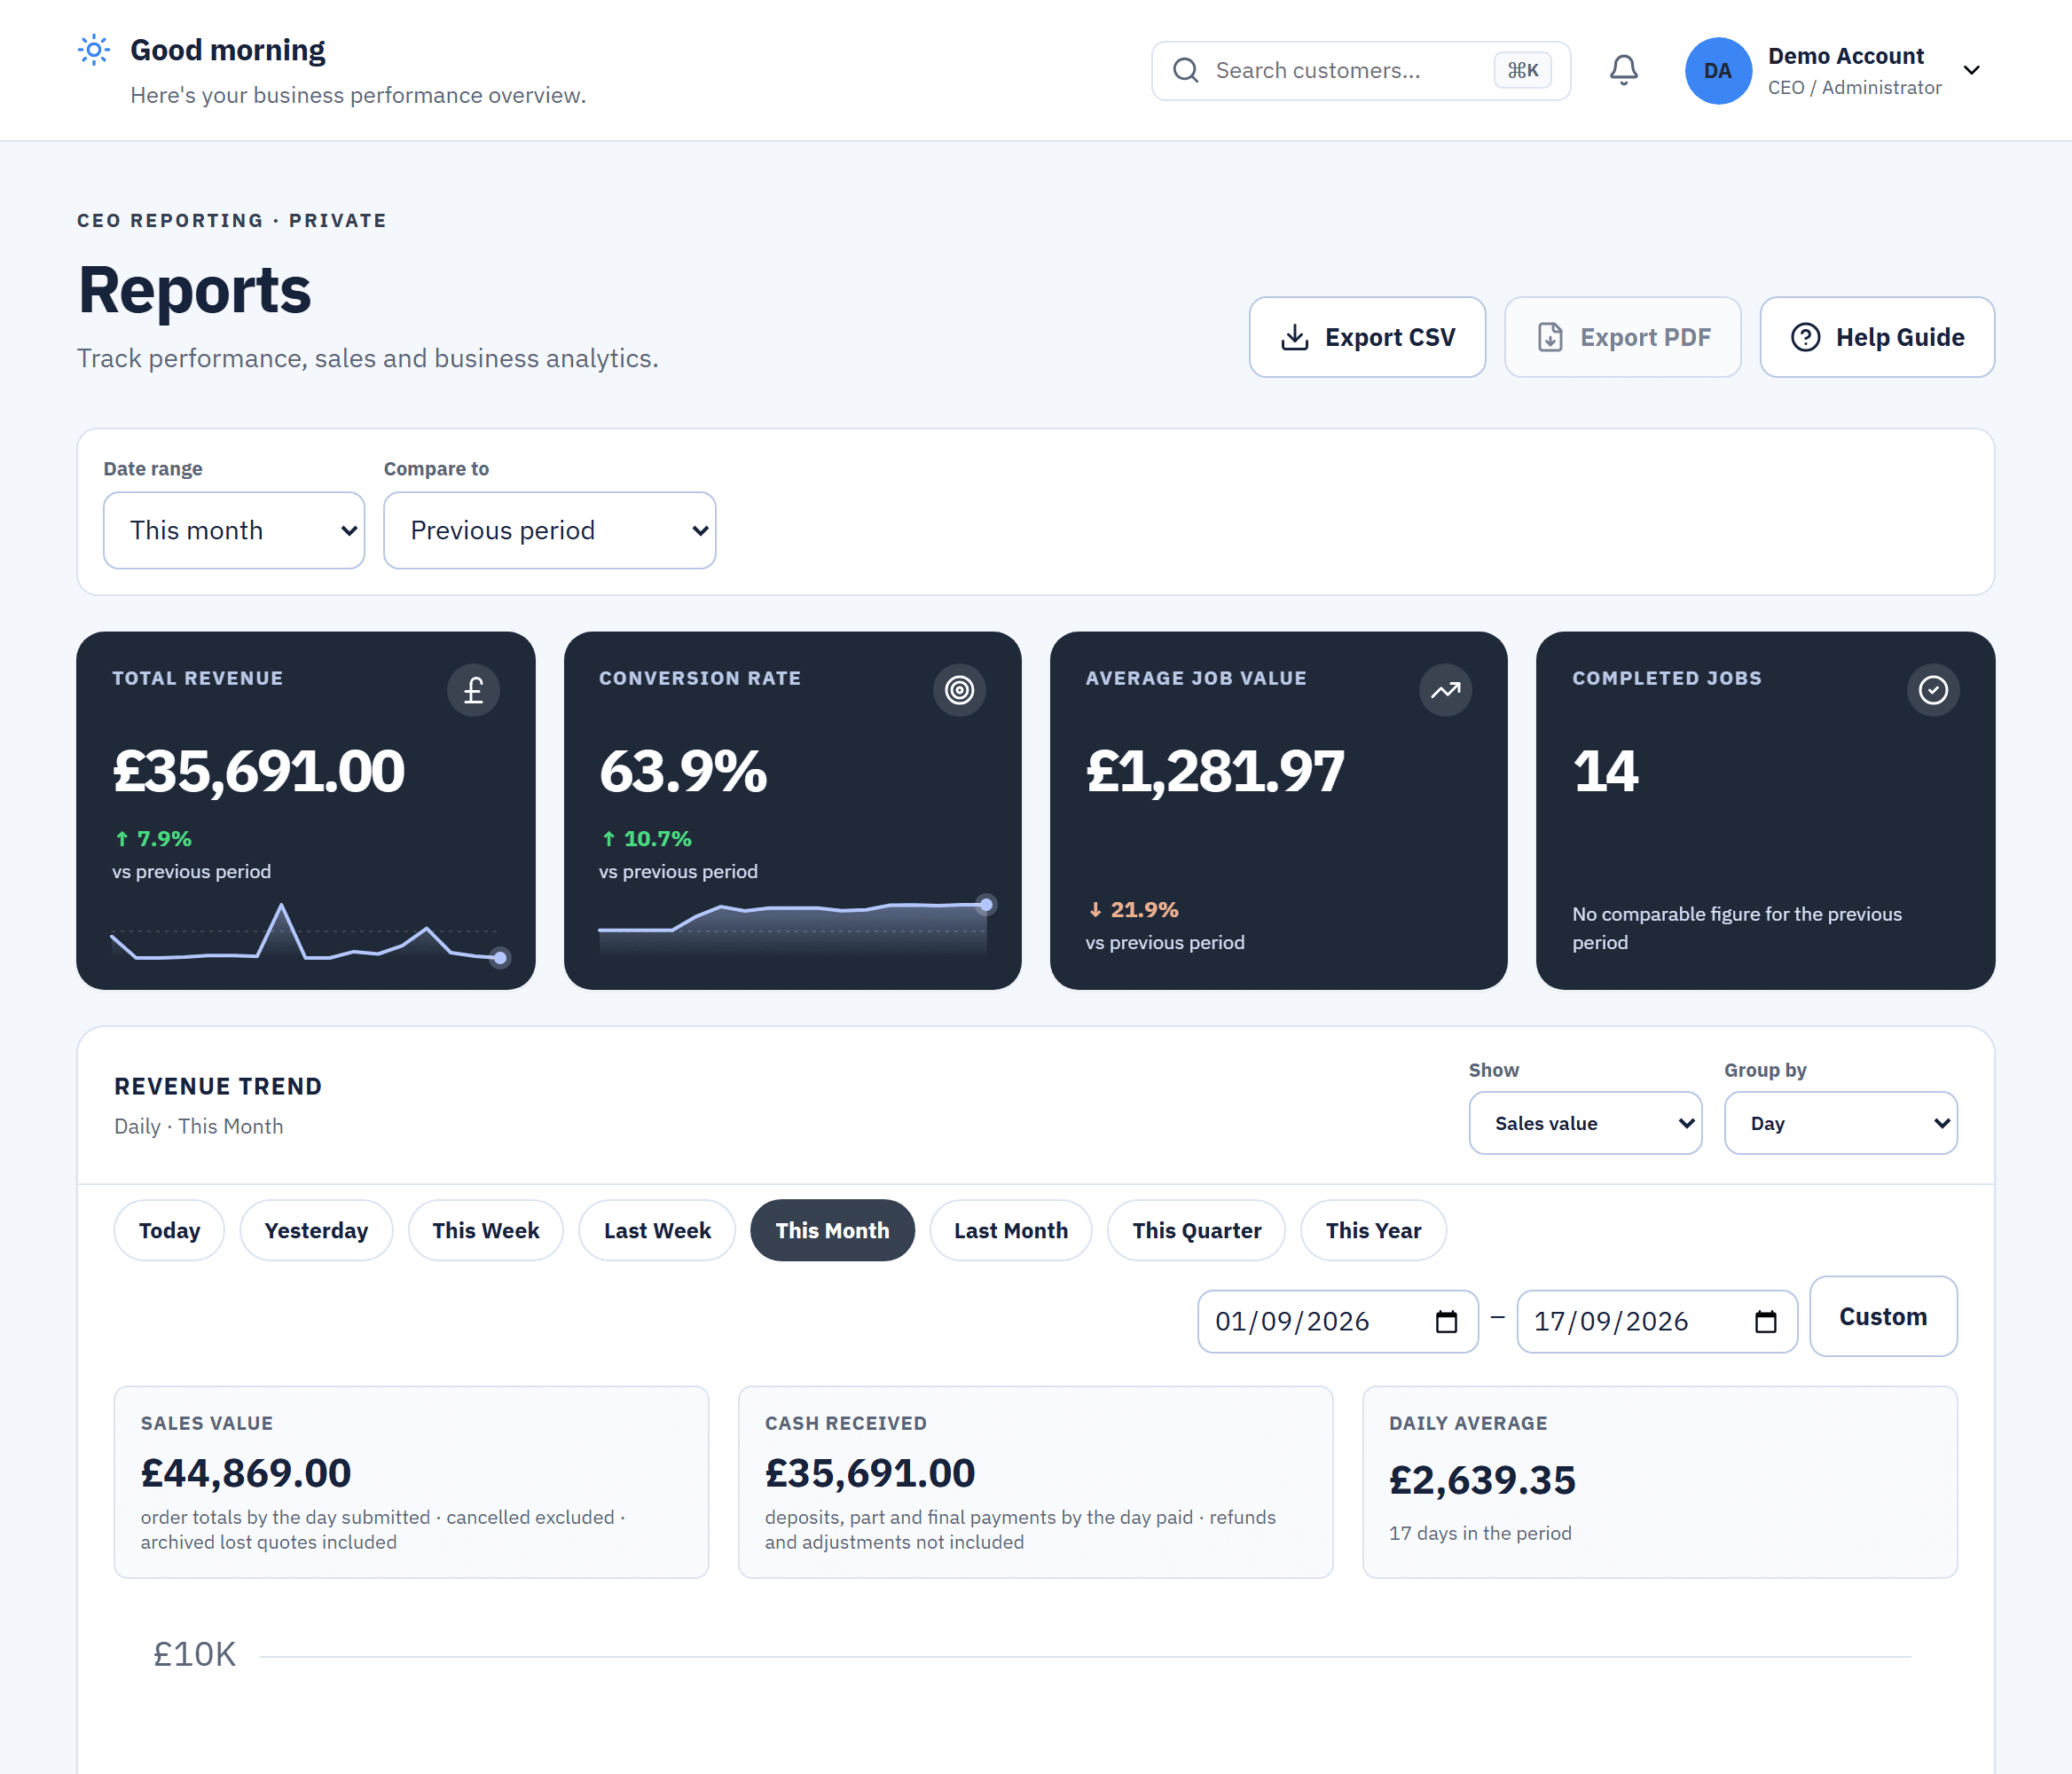
Real screens from the live demo, a fictional blinds business.
The numbers, the moment you log in.
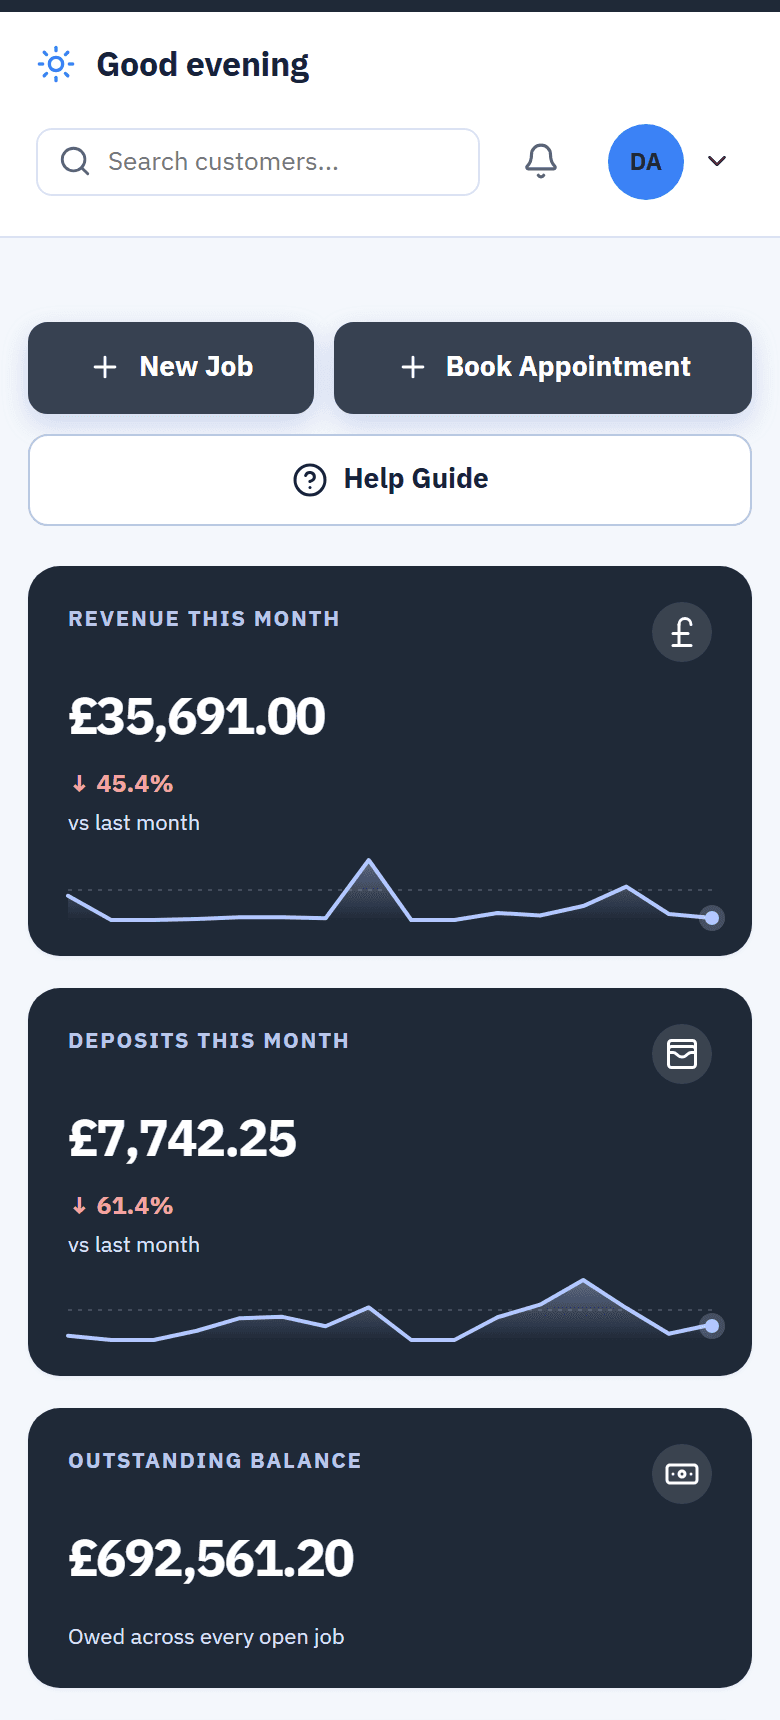
The CEO's dashboard opens on revenue, deposits, the outstanding balance and the conversion rate, each with its trend, then an overview of new leads, appointments, sales, the best lead source, manufacturing and Team Hub.Revenue, deposits, the outstanding balance and conversion, each with its trend.
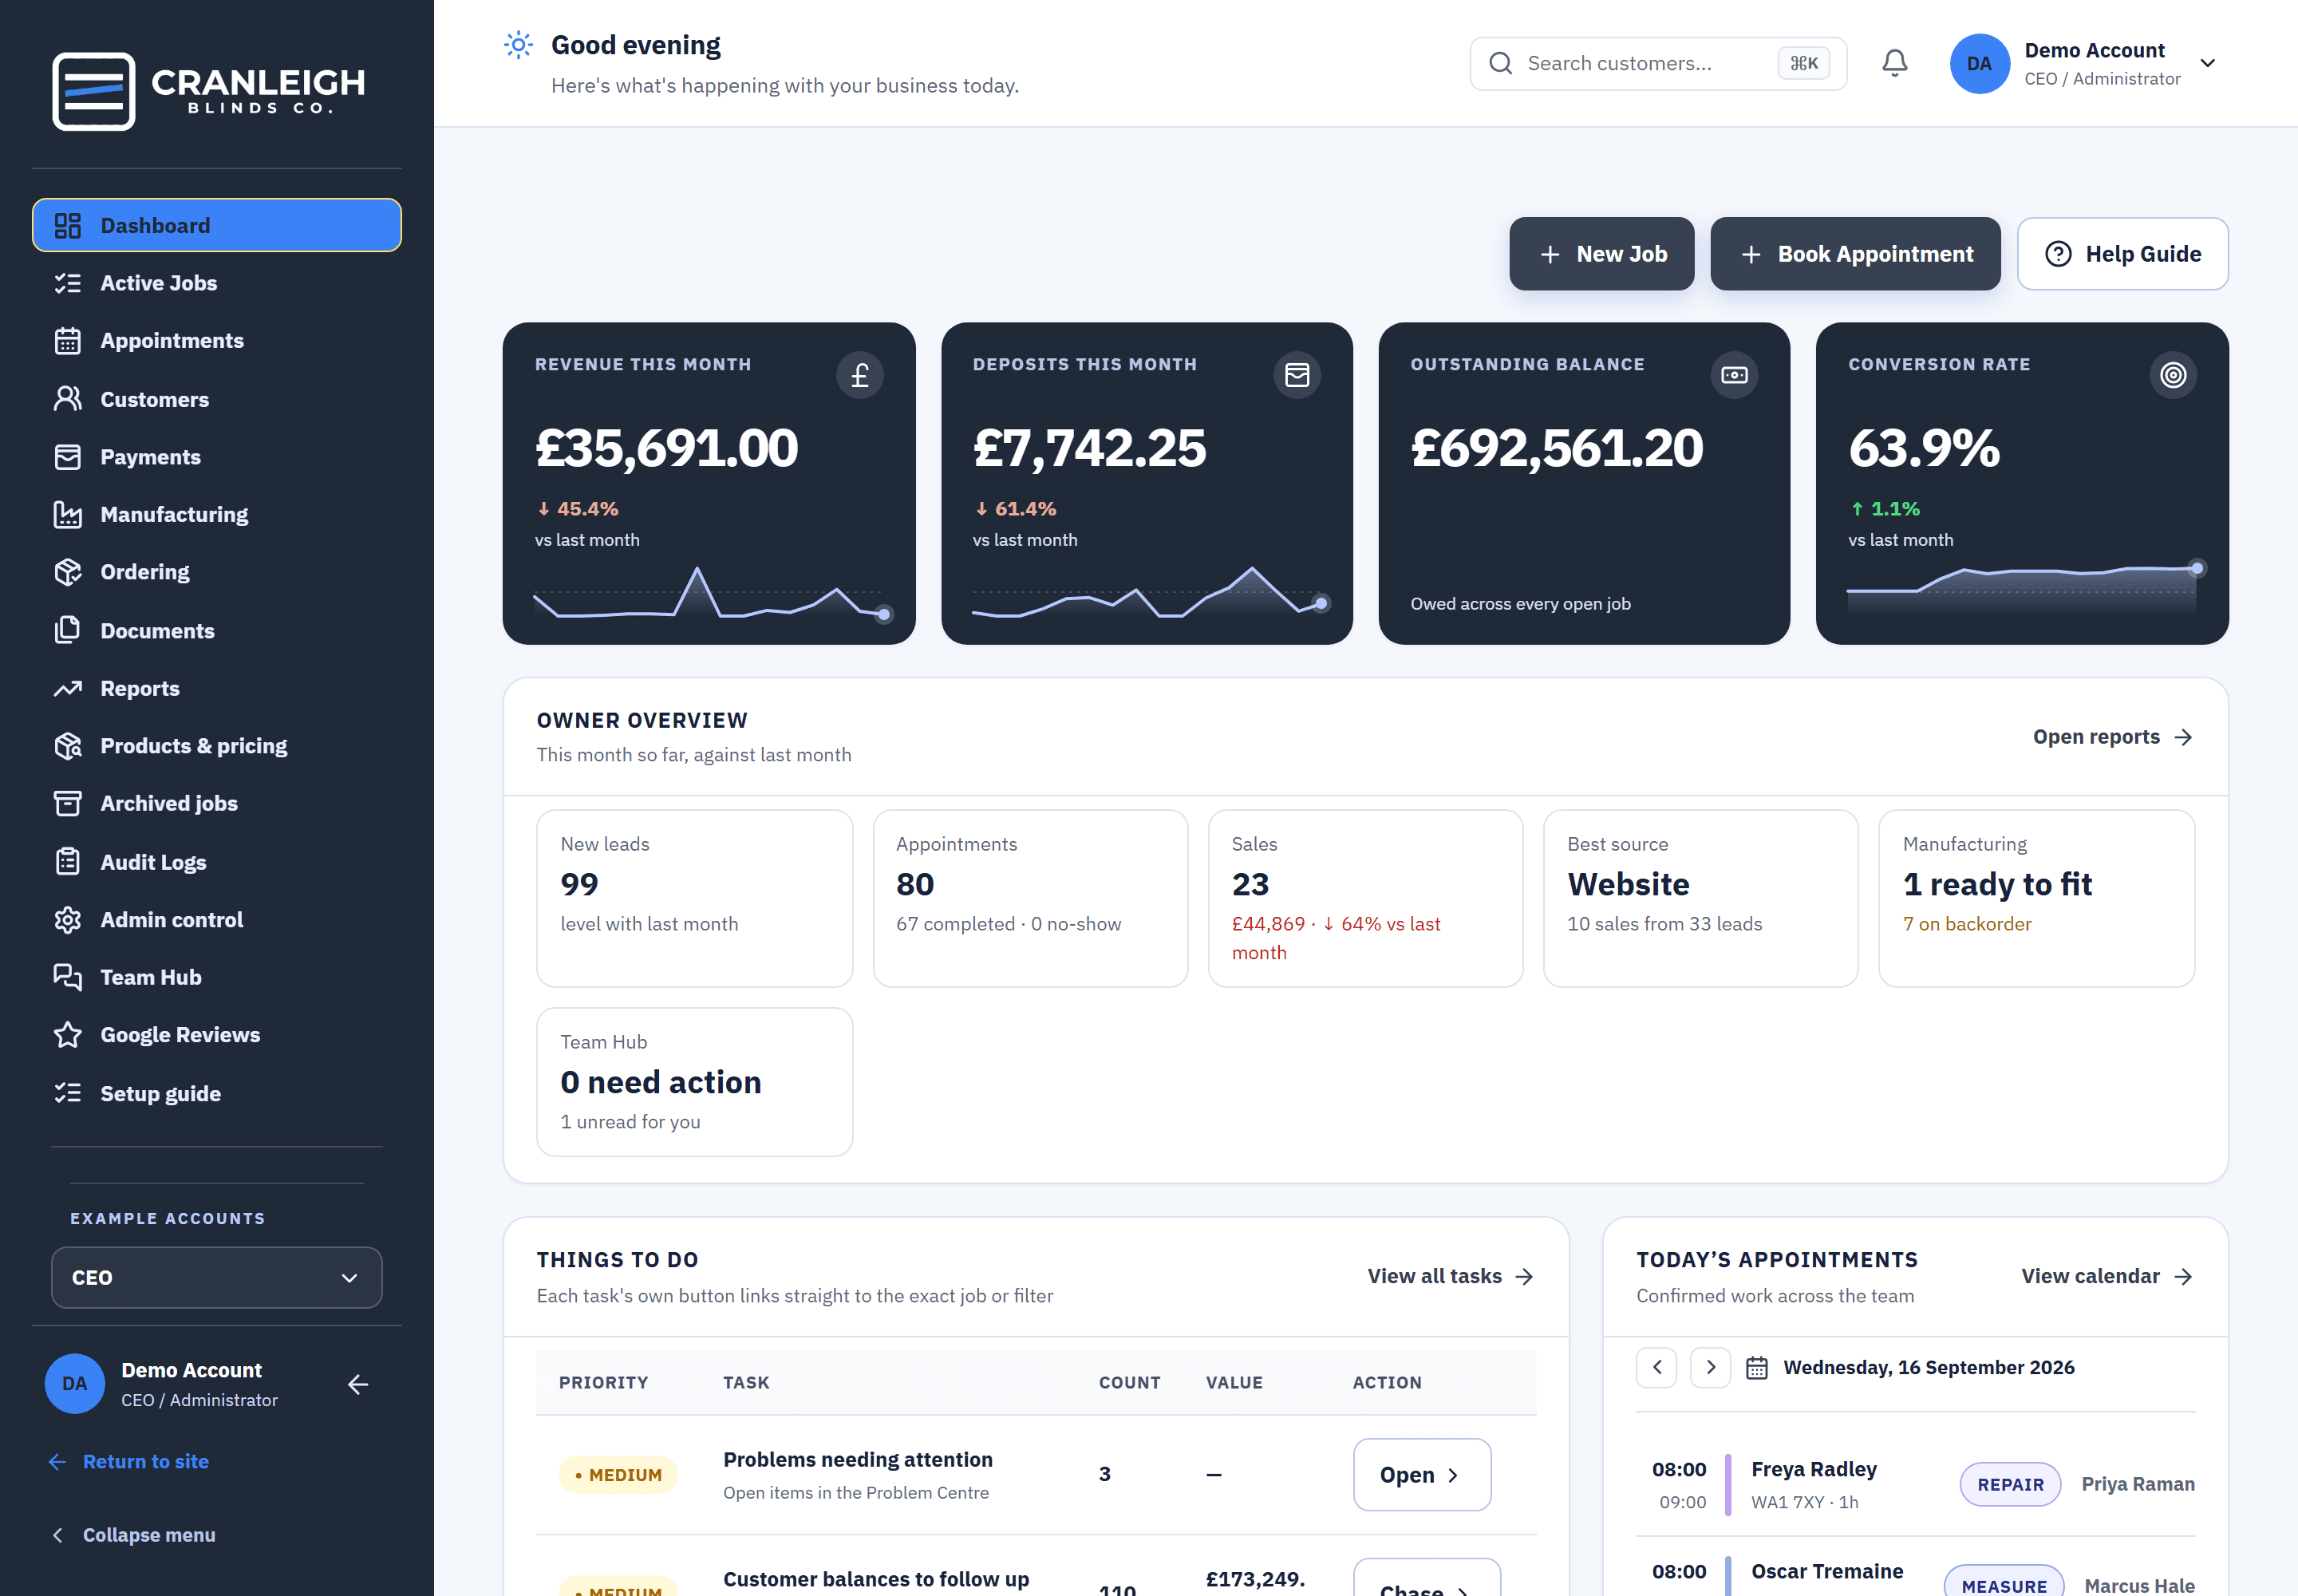
- Things to do. Deposits to chase, jobs to book and problems needing attention, each with a button to the exact job.
- Today's appointments. The confirmed work across the team, beside the figures.
See which lead sources turn into sales.
Every customer's lead source is recorded when they come in, so the reports show leads, bookings, sales and revenue by source, including the bookings each Extra made.Leads, bookings, sales and revenue by the source each customer came from.
- Every booking says who made it. Facebook, Gmail, your website or the office.
- Up to 400 days. Choose the range you want to look at.
- CSV export. Take the figures away as a CSV file.
Six connected reports
Each one is built from the same records, so a figure in one agrees with the same figure in another.
Overview
The headline figures for the period, with the revenue trend.
Leads & Marketing
Leads by the source each customer came from.
Sales
Sales and revenue, broken down by lead source and by fitter.
Appointments
The measures and fittings over the period.
Fitters
The work broken down by fitter.
Payments
The money recorded over the period.
Who sees the numbers
The CEO, by default
Reports are the CEO's unless the office is given access.
The office sees the work
The office dashboard is a task list, and never shows company-wide money totals.
From real records
Every figure is built from the jobs, appointments and payments your team records.
What to do with a number you don't like.
From the figure on the dashboard to the report behind it, and out to a file.
- Spot it on the dashboard. The numbers, the moment you log in.
- Open the report. Overview, Leads & Marketing, Sales, Appointments, Fitters or Payments.
- Change the range. Up to 400 days, against the previous period or last year.
- Export it. As a CSV file for your accountant or your own spreadsheet.
Questions about reports
Who can see the reports?
The CEO, unless the office is given access. The office dashboard shows tasks, never company-wide money totals.
How far back can I look?
Up to 400 days, compared with the previous period or the same time last year.
Can I see which Extra booked a job?
Yes. Every booking records who made it: Facebook, Gmail, your website or the office.
Can reports be emailed to me on a schedule?
No. Reports are opened in Blinds Base, and any of them can be exported to CSV.
Does it connect to my accounting software?
Not directly. The reports and lists export to CSV.
Related
See your numbers the moment you log in.
Open the reports in the live demo with no sign-up, or start your 14-day trial.